
Monitor home network traffic with OpenWRT and Syslog-ng with Elasticsearch Security. I wanted to see what happens on my home network. Is there something going on I should be aware of? Is there any device which creates suspicious connections like phoning home? I will use OpenWRT and syslog-ng to get the answers and Elasticsearch Security to get the analytics.
Table of Contents
Important updates: 12/02/2023
This post seems like getting some of attention from various people recently and I am very happy about it. I understand the need of reproducible configurations both for Syslog-NG and Elasticsearch, I would expect it too. I tried to address most of the problems mentioned in the comment section. The following changes occurred.
- syslog-ng’s configuration has been refactored and updated to match up version 4.5.0, also many hard wired settings are now populated via environment variables.
- A Dockerfile is provided to help people who requires container images. This image is only meant for transforming fail2ban, dnsmasq, unbound and ulogd2 logs to Elasticsearch. Although you can send any kind of logs to TCP 6514 (IETF syslog) or TCP 514 (BSD syslog) of the container, do not expect them to be properly indexed by Elasticsearch.
- Be aware. The Dockerfile initializes a copy of GeoLite2-City.mmdb from a 3rd party site. It is only for testing, implement your own method to fetch maps complying to the license requirements.
- The legacy index template “network” has been converted to composable template. Tested it with Elasticsearch 8.7.1
- Elasticsearch was installed by using this elkninja/elastic-stack-docker-part-one/docker-compose.yaml.
Regarding Elasticsearch I have changed my mind. It is simply an overkill for most people who monitors home network traffic with OpenWRT and Syslog-ng. Even I myself have abandoned it 2 years ago. Although I updated Elasticsearch configurations but they are not thoroughly tested and I am not even planning to test it in the future. I have plans to look for another more lightweight solutions for visualizations. And maybe run it next to Home Assistant on Kubernetes. 🙂
About monitoring home network traffic with OpenWRT and Syslog-ng
SOHO routers are usually not really resourceful, neither is mine. Therefore I needed a solution using as little resource as possible but still capable to answers that questions. My solution uses connection tracking data from an OpenWRT router. Offload the information from OpenWRT to a central syslog server. Enrich it with GeoIP and session length metadata by using syslog-ng. Then analyze the logs with Elasticsearch. Recently it has been also enchanced with DNS information thanks to either dnsmasq or unbound DNS servers.
The first part of this blog series answers where the packets come and go and some metrics. What are inside the packets is up to another posts.
Logging connection tracking data with OpenWRT and syslog-ng
My original idea was to log the SYN and ACK,FIN packets with Iptables on the FORWARD chain and correlate them. However it did not work as I planned. Although the most important data are included in syslog messages like network source, destination, port numbers. However the logs cannot be easily correlated to each other to get session data because there is no common identifier in iptables logs which would be unique to any given connection. (Stream ID would be but it is encoded in TCP options.) Logging all packets would simply kill the performance so it is not worth it. I needed an alternative solution.
Founding an essay about Flow-based network accounting in Linux did turn the tide. I realized that ‘nf_conntrack’ in Linux kernel (netfilter) actually keeps track of every connections throughout their lifetime (even UDP which is stateless). I only needed a tool to get that data off the OpenWRT router possibly to syslog-ng. The essay mentioned many tools but ulogd looked the most promising.
Ulogd is capable to log connection tracking data to local syslog. The following example shows a NEW and a DESTROY event of a specific connection logged by ulogd.
Mar 13 15:03:57 openwrt ulogd[21765]: [NEW] ORIG: SRC=172.18.0.227 DST=1.2.3.4 PROTO=TCP SPT=57534 DPT=443 PKTS=0 BYTES=0 , REPLY: SRC=1.2.3.4 DST=5.6.7.8 PROTO=TCP SPT=443 DPT=57534 PKTS=0 BYTES=0
Mar 13 15:09:00 openwrt ulogd[21765]: [DESTROY] ORIG: SRC=172.18.0.227 DST=1.2.3.4 PROTO=TCP SPT=57534 DPT=443 PKTS=9 BYTES=3371 , REPLY: SRC=1.2.3.4 DST=5.6.7.8 PROTO=TCP SPT=443 DPT=57534 PKTS=8 BYTES=1301
Note: 1.2.3.4 represents a website, while 5.6.7.8 represents the public IP of my home network.
Configuring ulogd2 on OpenWRT to send conntrack events to syslog-ng
My OpenWRT systems already send their syslog to a remote central syslog server. OpenWRT uses logread to send syslogs remotely. The remote server runs on syslog-ng. Therefore I only have to configure ulogd to send the connection tracking events to local syslog instead of a file.
Fortunately ulogd can send the events to many destinations. I found a post about logging connection tracking events with ulogd and it helped me to configure the service properly.
On the following link you can find the complete configuration of ulogd I created for OpenWRT 18.06 (works with 19.07 too). Nevertheless I describe the details below as well.
- First you have to install ulogd and some of its modules. You can do this either in LuCI or in the command line.
root@openwrt:~# opkg update \
&& opkg install ulogd ulogd-mod-nfct ulogd-mod-syslog ulogd-mod-extra
- The configuration of ulogd uses an INI style syntax. Two sections will be important for us, [global] and [ct1].
In [global] section after the list of plugins there will be presets of stacks. Stacks are a list of plugins and they work like commands piped together. There are input plugins, filter plugins and output plugins. - Look for the comment below. We are going to adjust the stack belonging to that comment like this.
# this is a stack for flow-based logging via LOGEMU
stack=ct1:NFCT,ip2str1:IP2STR,print1:PRINTFLOW,sys1:SYSLOG
- Look for the section called [ct1]. We are adding a new configuration element called hash_enable. Disabling hashes makes ulogd to log both NEW and DESTROY events separately. Otherwise it would only log DESTROY events. Although DESTROY contains everything we need the NEW events as well because of their timestamps, because we will make use of them for building session metadata.
[ct1]
hash_enable=0
- You can do a manual check of the configuration by starting ulogd manually.
root@openwrt:~# ulogd -v
Mon Mar 11 15:42:51 2019 <5> ulogd.c:843 building new pluginstance stack: 'ct1:NFCT,ip2str1:IP2STR,print1:PRINTFLOW,sys1:SYSLOG'
Mon Mar 11 15:42:51 2019 <5> ulogd_inpflow_NFCT.c:1399 NFCT plugin working in event mode
- The last step is to enable the service and start it.
root@openwrt:~# /etc/init.d/ulogd enable
root@openwrt:~# /etc/init.d/ulogd start
That is all you have to do to make OpenWRT send its connection tracking events to syslog-ng.
Update: Note for general Linux users. I found that netfilter accounting is usually disabled in kernels, especially on OpenSUSE Leap. This will result that PKTS and BYTES will always be 0. To overcome this one must enable accounting by executing the following command.
# runtime only
root@opensuse:~# echo "1"> /proc/sys/net/netfilter/nf_conntrack_acct
# make it permanent across system reboots
root@opensuse:~# echo 'net.netfilter.nf_conntrack_acct=1' > /etc/sysctl.d/100-custom.conf
Thanks to Eric Leblond’s great blog article for mentioning it.
Processing ulogd log messages from OpenWRT with syslog-ng
My goal is to parse and enrich ulogd messages with metadata like duration and GeoIP. Syslog-ng provides many parsers to use out of the box. You can see a short overview about the parsers I use in this case.
| Metadata we add to logs | Syslog-ng parsers providing the metadata |
| separate upstream and downstream metrics | csv-parser() |
| parsing key-value pairs from all streams | kv-parser() |
| creating session start, session end and length | grouping-by() |
| GeoIP metadata | geoip2() |
| Enrich DNS data from PublicSuffixList | python() |
Some parsers can be chained together in a single parser{} block. They behave like commands piped together in a Linux shell. One parser’s output will feed the input of the next parser. Thus their order is important.
As the configuration is rather long and complex I uploaded the complete syslog-ng configuration file to GitHub.
Correlating log messages from OpenWRT with syslog-ng
The central syslog server receives two type of log messages from each connection. One message from NEW events and another from DESTROY events. These two symbolize the beginning and the end of a session. I will use grouping-by() parser to correlate these messages into one context and get the session length metadata. The admin guide has a flow chart about how messages are added to the context and how it gets terminated. You may want to read that in advance.
The parser uses key() and scope() to build-up a context and identify which messages needs to be added to the context.
For specifying key() requires already parsed data. My setup can be translated to this: “Messages containing the same SRC, DST, SPT and DPT values from the ORIG part of the message belong to the same connection, unless they are not from the same host.“
parser p_correlate_session_data {
  grouping-by(
    key("${source.ip}/${destination.ip}/${source.port}/${destination.port}")
    scope("host")
    where(match("ORIG" value("MESSAGE")))
    trigger(match("DESTROY" value("MESSAGE")))
    having( "${UNIXTIME}@2" ne "1" )
    aggregate(
      value("event.start" "${ISODATE}@2")
      value("event.end" "${ISODATE}@1")
      value("event.duration", "$(- ${UNIXTIME}@1 ${UNIXTIME}@2)")
      value("MESSAGE" "Session completed; client='${source.ip}'; server='${destination.ip}'; destination_port='${destination.port}; protocol='${network.transport}'; session_lenght='${event.duration}'\n")
      inherit-mode("context")
    )
    inject-mode("pass-through")
    # destroy events sometimes arrive later than 2 minutes, even when a client app is already closed (ssh, telnet)
    timeout(600)
  );
};
The context will be closed and evaluated either when a message arrives which matches the filter specified in having() or the timeout() occurs.
Important! The timeout is currently set to 10 minutes. Connections longer than 10 minutes will set to 10 minutes in Elasticsearch.
The evaluation will aggregate the context and creates new name-value pairs specified with values(). For example, it creates a new MESSAGE. This message is logged the same place where the received logs are stored. Actually I only need the parsed name-value pairs for Elasticsearch. The existence of this message indicates that everything is available. Therefore I will filter on this message later.
Configuring DNS data parsing with syslog-ng’s Python parser
Note: the original post mentioned reverse DNS data but the script I used did not have a permissive license so I decided to abandon it. The current solution does not use reverse DNS anymore.
Elasticsearch relies on DNS data. It parses the DNS packets by packetbeat but that is too heavy for OpenWRT. Lucky for us almost everything can be parsed from query logs of DNS server software like dnsmasq or unbound.
OpenWRT uses dnsmasq by default. You can turn on query logging in “DHCP and DNS → Server settings → General settings → Log queries“. That’s all.
Please note that I rather use unbound because of its support for DNS over TLS (DoT). The syslog-ng config I have for dnsmasq is pretty outdated but it can be easily updated with the example of unbound. Pull requests are welcome. 😉
DNS logs should be parsed further to get domain, tld, subdomain and regdomain, all the fancy stuff Elasticsearch supports. This is done by a python parser. Specifying the python parsers should look like this.
parser p_unbound_csv {
    csv-parser(
        columns(question.ptid, syslog.level, source.ip, dns.question.name, dns.question.type, dns.question.class)
        delimiters(chars(' '))
        template("${MESSAGE}")
    );

    map-value-pairs(
        pair("event.action",                "dns-query")
        pair("destination.ip",              "172.18.0.10") # DNS server
        pair("event.category",              list("network"))
        pair("event.dataset",               "network.dns")
        pair("event.kind",                  "event")
        pair("event.module",                "network")
        pair("event.provider",              "unbound")
        pair("event.type",                  "info")
        pair("tags",                        list("syslog-ng"))
        pair("dns.type",                    "query")
        pair("network.direction",           "outgoing")
    );

    python(
        class("DNSSuffixResolver")
        options(
            "domain" "dns.question.name"
            "tld" "dns.question.top_level_domain"
            "subdomain" "dns.question.subdomain"
            "regdomain" "dns.question.registered_domain"
        )
    );
};
Public Suffix List is used to parse domain, tld, subdomain and regdomain from FQDNs. A python module with the same name is used by syslog-ng for the parsing. The database must be regurarly updated. Here is a simple cronjob to do that.
0 4 * * * curl https://raw.githubusercontent.com/publicsuffix/list/master/public_suffix_list.dat -o /usr/lib/python3.6/site-packages/publicsuffixlist/public_suffix_list.dat &>/dev/nullBoth syslog-ng configuration and the parsers code are uploaded to GitHub.
Configuring GeoIP enrichment for syslog-ng
Syslog-ng so as Elasticsearch relies on Maxmind’s GeoIP databases. You should register yourself to be able to periodically download the databases. I provided an example config. The most important parts are that the downloaded databases should be placed in /etc/syslog-ng. This way you do not have to adjust Apparmor settings.
Configuring Elasticsearch to ingest logs from OpenWRT
Sending network traffic data of your home network from OpenWRT to syslog-ng is a great thing. But what is more cooler is to send it to Elasticsearch and create visualizations and reports. You can create nice visualizations once you have proper index template including ECS compatible data type mapping. I emphasize that without this step Elasticsearch Security will not work at all.
Creating an index template for network events
Explicit mapping should be created manually by using Elasticsearch’s PUT API. You can do this in Dev Tools → Console. If this is new to you, then you should check my previous step by step guide about it.
Because of the length of the mapping file I provide a downloadable version of the index template in the following file on GitHub.
Please note that this mapping also specifies a template for the index names it will match on. In my case it is network-*.
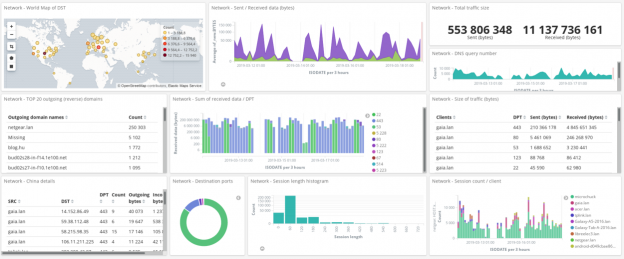
Monitoring my home network with examples
I already created videos about how you can make different type of visualizations in Kibana. You should definitely check the videos if you are stuck. Therefore this time I picked up two recent cases because I wanted to focus on what benefits I could get by having network data in Elastic.
Where and how are my images uploaded by using a web printing service?
Update: The examples below used an older implementation and the attribute names are different from ECS mappings. However you can still get the idea.
I wanted to print dozens of family photos on paper. I decided to use CEWE’s service to do that. They even have a Qt based software for Linux to place orders.
I wanted to feel secure as I am about to upload private data to someone else’s computer. Where are they uploaded? Are those services use HTTPS for transferring my precious family photos? Let’s find that out.
Note: My actions did take place between 21:00 and 22:30 on March 17th, 2019.
- In the browser’s address bar I noticed that registration and uploading takes place on “photoprintit” domains via HTTPS. Let’s check the traffic belonging to those domains. Using the following regex query outbound.destination.address:*photoprint* on the dashboard gave me the following results.

- On the top left corner in Coordinate Map visualization we can see that all traffic goes to Germany (I am located in Hungary). As a result I checked the service’s Data Privacy document which also shows that both their web site and the hosting is located in Germany.
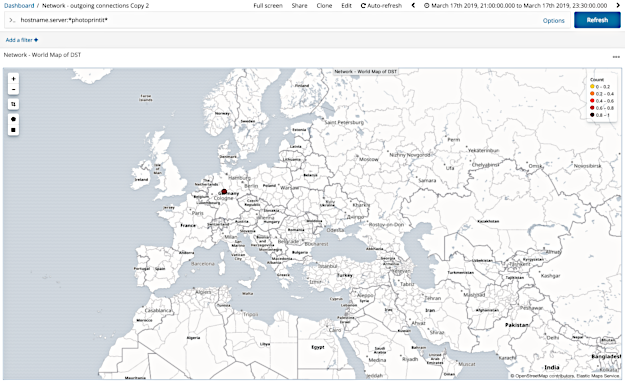 The service provider is a German company, however it is quite funny that I had to send my photos to Germany for printing so they will deliver them back to Hungary.
 - Do they use HTTPS for the traffic? Let’s use a Data Table visualization to see that. It seems like that there are some traffic on 80, however most of the traffic goes to 443 (HTTPS).


I did not have to do any extra work to get these information because GeoIP, Reverse DNS, traffic size and details are all there. As a result I could do the same exercise with any other web site.
Is there any device on my network phoning home?
Is there any network traffic going to a specified country, for instance is there anything going to China unattended? (I could choose any other country.)
Note: In the following examples I excluded a client host where I made explicit connections to Chinese websites. Data is from 11 day long period.
- We can filter on a country by using outbound.destination.geo.country_name:China.

- According to the results there are two devices which communicate to that country. The device tplink.lan is a WiFi Access Point running on OpenWRT. The other device Galaxy-A5-2016.lan is a smartphone connecting to that access point over WiFi.
Let’ see the details on a different Data Table visualization again.


Apparently there are communication going outwards of my home network, however I still do not know what is inside of them. That WiFi Access Point used NAT a couple of days ago until I disabled it, seems like there may be duplicate entries.
A logical next step would be to run tcpdump on OpenWRT parameterized to only capture and save TCP packets going on to those IP addresses. You can further analyze the packet captures with other tools. But this is a topic of another post I will write later.
Verdict
I hope that with the help of this blog post anyone can monitor their home network with OpenWRT and syslog-ng and Elasticsearch.
If this post was helpful for you, then please share it. Even more should you have anything to ask then feel free to make any comments below. I will highly appreciate it.
Hi,
Great tutorial…
I have installed SELKS 5, Debian based, and upgraded syslog-ng to the latest from the unnoficial repository, to get the python parser support.
Still no luck and syslog-ng fail with an error,
selks-user@SELKS:/etc/syslog-ng$ sudo syslog-ng -Fedv
 [2019-07-01T09:22:17.096428] Error loading Python module; module='_syslogng_main', exception='exceptions.ImportError: No module named _syslogng_main'
 ImportError: No module named _syslogng_main
 [2019-07-01T09:22:17.096736] Error looking Python parser class; parser='p_reversedns_server', class='SngResolver', exception='None'
 [2019-07-01T09:22:17.096939] Error printing proper Python traceback for the exception, printing the error caused by print_exception() itself;
 SystemError: NULL object passed to Py_BuildValue
 [2019-07-01T09:22:17.097286] Error initializing message pipeline; plugin_name='python', location='/etc/syslog-ng/conf.d/network.conf:36:5'
I have taken the config files from the github…
Can you help about this ?
Have you plans about simplifying the monitoring tutorial from OpenWRT with ELK (or equivalent)…
Thanks
Hi,
I remember in 3.22 the developers incorporated some changes regarding python module support.
However my code still works. I am going to update the github repo with the latest changes I have. Give it a try and let me know if still breaks.
You shall also compare the available plugins in your installation with mine.
# syslog-ng -V
 syslog-ng 3 (3.22.1)
 Config version: 3.22
 Installer-Version: 3.22.1
 Revision:
 Module-Directory: /usr/lib64/syslog-ng
 Module-Path: /usr/lib64/syslog-ng
 Include-Path: /usr/share/syslog-ng/include
 Available-Modules: add-contextual-data,affile,afprog,afsocket,afstomp,afuser,appmodel,basicfuncs,cef,confgen,cryptofuncs,csvparser,date,dbparser,disk-buffer,examples,graphite,hook-commands,json-plugin,kvformat,linux-kmsg-format,map-value-pairs,pseudofile,sdjournal,snmptrapd-parser,stardate,syslogformat,system-source,tags-parser,tfgetent,xml,mod-python,geoip-plugin,geoip2-plugin,http
 Enable-Debug: off
 Enable-GProf: off
 Enable-Memtrace: off
 Enable-IPv6: on
 Enable-Spoof-Source: on
 Enable-TCP-Wrapper: on
 Enable-Linux-Caps: on
 Enable-Systemd: on
ps: I have some plans moving away from the python parser. I know that Logstash can do geoip resolving, however it is way to resource heavy.
Recently I changed my logging settings and I am getting correct DNS data from dnsmasq running on OpenWRT. The only thing preventing me posting it here is the lack of integration with ulogd2 logs.
look like better and promising with this version of the python parser…
Now I still have an issue but it is now in the Kibana Console;
The PUT _template…… get me stuck in an error :
 {
 "error": {
 "root_cause": [
 {
 "type": "mapper_parsing_exception",
 "reason": "Root mapping definition has unsupported parameters: [nf_orig : {properties={BYTES={type=integer}, DST={type=ip}, SRC={type=ip}, SPT={type=integer}, DPT={type=integer}, PKTS={type=integer}}}] [nf : {properties={SESSION_END={type=date}, SESSION_START={type=date}, SESSION_LENGTH={type=integer}}}] [geoip2 : {properties={location2={type=geo_point}}}] [nf_reply : {properties={BYTES={type=integer}, DST={type=ip}, SRC={type=ip}, SPT={type=integer}, DPT={type=integer}, PKTS={type=integer}}}]"
 }
 ],
 "type": "mapper_parsing_exception",
 "reason": "Failed to parse mapping [properties]: Root mapping definition has unsupported parameters: [nf_orig : {properties={BYTES={type=integer}, DST={type=ip}, SRC={type=ip}, SPT={type=integer}, DPT={type=integer}, PKTS={type=integer}}}] [nf : {properties={SESSION_END={type=date}, SESSION_START={type=date}, SESSION_LENGTH={type=integer}}}] [geoip2 : {properties={location2={type=geo_point}}}] [nf_reply : {properties={BYTES={type=integer}, DST={type=ip}, SRC={type=ip}, SPT={type=integer}, DPT={type=integer}, PKTS={type=integer}}}]",
 "caused_by": {
 "type": "mapper_parsing_exception",
 "reason": "Root mapping definition has unsupported parameters: [nf_orig : {properties={BYTES={type=integer}, DST={type=ip}, SRC={type=ip}, SPT={type=integer}, DPT={type=integer}, PKTS={type=integer}}}] [nf : {properties={SESSION_END={type=date}, SESSION_START={type=date}, SESSION_LENGTH={type=integer}}}] [geoip2 : {properties={location2={type=geo_point}}}] [nf_reply : {properties={BYTES={type=integer}, DST={type=ip}, SRC={type=ip}, SPT={type=integer}, DPT={type=integer}, PKTS={type=integer}}}]"
 }
 },
 "status": 400
 }
Hope you’ll help me on this also, tanks you…
PS : will try to get test on your next release, do you preffer issue on your github ? or comment here is ok ?
Hi,
I think the problem is with the syntax. The mapping syntax changed in Elastic 7.x. The one uploaded to GitHub is for v7.x
If you are using and older version then try to add back the the nested type directive. In my case it was called ‘test’. Check the diff for hints.
I plan to rework the current mapping as it is totally ad-hoc and does not follow ECS. I try to do it this week but it is not a promise. 🙂
Commenting here is okay. Once the visibility of the github repos may arise I will switch over there.
Hy,
following this https://www.elastic.co/guide/en/elasticsearch/reference/7.0/deb.html
I will upgrade my SELKS 5 debian 9 (stretch) with the latest from ElasticSearch and give a try…
Thanks…
Just upgraded from 6.8.1 to 7.2.0 with success…
I get now
{
“acknowledged” : true
}
But still get no indexes network-* nor any data…
May be I still misunderstood how kibana and elastcisearch do work…
The basic procedure is this:
1) upload index mapping which expects the index names matching “network-*”. As I understand you already did that.
2) Send data into Elastic with syslog-ng
3) Create index pattern in Kibana matching index names “network-*”, then go to Discover. You should be able to see the documents there.
I have to verify the hostname in the syslog-ng/network.conf like the ip from the /var/log/network/IP
I also put the url to elastic as 127.0.0.1 in syslog-ng/network.conf
Then I get datas uploaded from my OpenWRT (ulogd > syslog-ng > elasticsearch)
I have created the index with network and now I can discover datas…
Will follow with making dashboards ! (hope to)
thanks
It works… thanks
Great to hear that! 🙂
got some errors in syslog-ng like :
[2019-07-03T09:44:42.267530] Parsing failed, template function's second argument is not a number; function='-', arg2=''It is hard to determine the cause of this without context. I’ve been reworking the network.conf and the Elastic part since yesterday to make it more easy to use and better comply with ECS.
If you are interested I will upload the changes to github in the following days and update the blog post accordingly.
Yes, verry interested to tests all this !
Could you also post some dashboards on GitHub…
THANKS
I have updated the blog post as well as the GitHub page with the latest changes.
It is better to use it from scratch. You may need to
DELETE _template/network_openwrtbefore you upload the new one.I also exported my visualizations and dashboards that you can import in Kibana -> Saved objects.
Let me know how it works for you.
all works fine !
great job…
Thank you
Thank you very much.
I am happy that what I’ve done could be useful for others too.
got also theses errors loged ;
[2019-07-03T09:49:17.774850] Incoming log entry from journal; message='{"type":"log","@timestamp":"2019-07-03T07:48:59Z","tags":["error","task_manager"],"pid":373,"message":"Failed to poll for work: [cluster_block_exception] index [.kibana_task_manager] blocked by: [FORBIDDEN/12/index read-only / allow delete (api)]; :: {\"path\":\"/.kibana_task_manager/_update/Maps-maps_telemetry\",\"query\":{\"if_seq_no\":91,\"if_primary_term\":13,\"refresh\":\"true\"},\"body\":\"{\\\"doc\\\":{\\\"type\\\":\\\"task\\\",\\\"task\\\":{\\\"taskType\\\":\\\"maps_telemetry\\\",\\\"state\\\":\\\"{\\\\\\\"runs\\\\\\\":1,\\\\\\\"stats\\\\\\\":{\\\\\\\"mapsTotalCount\\\\\\\":0,\\\\\\\"timeCaptured\\\\\\\":\\\\\\\"2019-07-02T09:58:11.782Z\\\\\\\",\\\\\\\"attributesPerMap\\\\\\\":{\\\\\\\"dataSourcesCount\\\\\\\":{\\\\\\\"min\\\\\\\":0,\\\\\\\"max\\\\\\\":0,\\\\\\\"avg\\\\\\\":0},\\\\\\\"layersCount\\\\\\\":{\\\\\\\"min\\\\\\\":0,\\\\\\\"max\\\\\\\":0,\\\\\\\"avg\\\\\\\":0},\\\\\\\"layerTypesCount\\\\\\\":{},\\\\\\\"emsVectorLayersCount\\\\\\\":{}}}}\\\",\\\"params\\\":\\\"{}\\\",\\\"attempts\\\":0,\\\"'[2019-07-03T09:49:17.774864] json-parser(): no marker at the beginning of the message, skipping JSON parsing ; input='{"type":"log","@timestamp":"2019-07-03T07:48:59Z","tags":["error","task_manager"],"pid":373,"message":"Failed to poll for work: [cluster_block_exception] index [.kibana_task_manager] blocked by: [FORBIDDEN/12/index read-only / allow delete (api)]; :: {\"path\":\"/.kibana_task_manager/_update/Maps-maps_telemetry\",\"query\":{\"if_seq_no\":91,\"if_primary_term\":13,\"refresh\":\"true\"},\"body\":\"{\\\"doc\\\":{\\\"type\\\":\\\"task\\\",\\\"task\\\":{\\\"taskType\\\":\\\"maps_telemetry\\\",\\\"state\\\":\\\"{\\\\\\\"runs\\\\\\\":1,\\\\\\\"stats\\\\\\\":{\\\\\\\"mapsTotalCount\\\\\\\":0,\\\\\\\"timeCaptured\\\\\\\":\\\\\\\"2019-07-02T09:58:11.782Z\\\\\\\",\\\\\\\"attributesPerMap\\\\\\\":{\\\\\\\"dataSourcesCount\\\\\\\":{\\\\\\\"min\\\\\\\":0,\\\\\\\"max\\\\\\\":0,\\\\\\\"avg\\\\\\\":0},\\\\\\\"layersCount\\\\\\\":{\\\\\\\"min\\\\\\\":0,\\\\\\\"max\\\\\\\":0,\\\\\\\"avg\\\\\\\":0},\\\\\\\"layerTypesCount\\\\\\\":{},\\\\\\\"emsVectorLayersCount\\\\\\\":{}}}}\\\",\\\"params\\\":\\\"{}\\\",\\\"attempts\\\":0,\\\"scheduledAt\\\":\\\"2019-07-02T09:58:11.518Z\\\",\\\"runAt\\\":\\\"2019-07-03T07:49:59.504Z\\\",\\\"status\\\":\\\"running\\\"},\\\"kibana\\\":{\\\"uuid\\\":\\\"21ca7904-ac5c-4314-b75e-3996fd5c3c42\\\",\\\"version\\\":7020099,\\\"apiVersion\\\":1}}}\",\"statusCode\":403,\"response\":\"{\\\"error\\\":{\\\"root_cause\\\":[{\\\"type\\\":\\\"cluster_block_exception\\\",\\\"reason\\\":\\\"index [.kibana_task_manager] blocked by: [FORBIDDEN/12/index read-only / allow delete (api)];\\\"}],\\\"type\\\":\\\"cluster_block_exception\\\",\\\"reason\\\":\\\"index [.kibana_task_manager] blocked by: [FORBIDDEN/12/index read-only / allow delete (api)];\\\"},\\\"status\\\":403}\"}"}', marker='@cim:'
This looks to be unrelated to the topic. Seems like there is a permission issue in Kibana.
yes, looks like my upgrade of SELKS do broke some access…
Will try to do a fresh install on a new Debian of ELK…
If you have advice about howto and tutorial, thanks… 😉
Look okay with the latest from your github…
I used a new fresh SELKS install, upgrade syslog-ng to latest from unnofficial repository, upgraded ElasticSearch, LogStash and Kibana to 7.2 from official repository.
I also upgraded the latest java-open.
Then I downloaded the GEOIP with your script from the fail2ban post.
Configure syslog-ng and add network-* index from kibana (after a small data added).
I also added your templates and dashboards (fine, thank you)…
thanks again…
a samll tips, to help; I have done this on network.conf that make the configuration more “generic/portable”
root@SELKS:~# cat /etc/syslog-ng/conf.d/network.conf
@define network_ip “0.0.0.0”
@define router_hostname “netgear”
@define elastic_host “127.0.0.1:9200”
A new question rise to me.
Is it possible to log any traffic with ulogd, like on a switch listening mode ?
Not the traffic which get through the routeur, but the traffic listened on a switch ?
It’s a little off topic about your tutorial, but it may quickly be adapted to get a mirror port device passively listen the home network traffic without requesting to get a OpenWrt Routeur, but a sepcific device for network traffic analysis…
Thanks if you can help me to understand how to make this …
Depending on what log a given switch could produce, you can integrate them into Elasticsearch too.
If if can run ulogd then it should be easy.
If it is NetFlow then that should be also achievable.
I picked my main router as it has the singe point of view about connections.
OpenWRT can be also used to produce netflow data. Also it can mirror the traffic via iptables to other host where you can analyze it with Suricata. I have plans to do it, but ulogd seemed to be a low hanging fruit compared to the complexity and network requirements of port mirroring.
Héllo again…
I am still testing ulogd with a bridge interface… All may works but I am not getting like tcpdump from ulogd, only UDP but not the full TCP ? Can you help about what I am missing ?
Hello again,
Do you mean that ulogd is set up to send logs to remote syslog?
Or you only get logs about UDP packets but not TCP?
> Or you only get logs about UDP packets but not TCP?
I am getting only UDP with ulogd…
First please compare your ulogd config to mine.
I would also check TCP traffic with tcpdump to see whether are there any TCP traffic at all.
Try enabling promiscuous mode on your interfaces to see all the traffic it could possibly see.
If the issue is not with ulogd (I doubt it) then probably it is in your network.
Thanks for the tips;
I have checked again your configuration (backuped mine and set yours) and same behaviour of ulogd…
I have already tcpdump and all is okay with it… full paquet logging when I specify my bridged lans network interface…
ulogd receive only paquets from the WAN interface, which is used for ssh and syslog/ulog, and also http (for luci interface)…
My bridged interface, without IP stack do not look to logging into ulog…
I have tested with IP stack, same behaiour…
I also made promisc mode on all networks interfaces, but get nothing more…
Can I use ulogd to specifically log an interface ? (my bridged one)…
Can I use ulogd with the NFCT plugin to log ethernet bridged interface (like a TAP passive monitoring interface) ?
If I disable or stop iptables, i get nothing at all, ulogd become full silent !
Did I need some IPTABLES rules to get my bridge interface talking with ulogd ?
Thanks at all for any help you can give me…
On my OpenWRT router I also have a bridge called br-lan and I did not had to configure anything related to interfaces. My WAN interface is not a member of a bridge.
However as far as I know NFCT (libnetfilter_conntrack) only reads data from the kernel’s connection track table. It is not interface specific from this perspective.
Try to install the ‘conntrack’ package in OpenWRT to see what do you have in the conntrack table.
As long as you cannot see there what you want to see then ulogd would not see either.
You right, I suppose my problem is wit the DSA (mvebu) bridge config…
I open a question on OpenWRT Forum: https://forum.openwrt.org/t/dsa-switch-bridge-config-for-ulog2-traffic-analysis/51545
Hope to get support there…
thanks again…
I hope you will get help there.
You are welcome.
Hy again for some feedback…
I am thinking now that conntrack will be useless on a switch bridged monitoring solution…
Because there is no connection to track…
I have get somme success with the TCPDUMP, or while mirroring the traffic…
But only with NFLOG for logging purpose…!
Is your solution is adaptable to NFLOG instead of NFCT ?
Thanks
Hello,
The syslog-ng’s configuration was especially made for NFCT support. I assume NFLOG would provide logs in the same good old iptables log format.
If that is the case then I would not bother with syslog-ng to process and send it to Elastic, but only store the logs somewhere and use Filebeat’s iptables module to send them directly to Elasticsearch.
Regards,
Okay, thanks for the advice…
But I really like the remote OpenWRT monitoring sender to a PC/Server analysis systems like…
May be I will find such a tutorial somewhere on Internet…
Regards
What I suggested will do the same. You can use NFLOG as I assume its output will be syslog messages on OpenWRT. What you can send to a remote syslog host the same way as with NFCT with syslog-ng (client side).
I just would not want to do the processing and transformation of logs with syslog-ng (server side) but use Filebeat to read up the files stored by syslog-ng and transfer them to Elasticsearch.
Regards,
will try this…
But looks like all is working now !…
conntracking from my bridge to the remote server SELKS…
Great, and thanks for the help, advice and sharing !
Glad it works now. Do you know what was the issue?
You’re welcome.
The issue is about the DNS resolve…
The syslog-ng of my server looks like to flood the DNS and make so lot of UDP 54 call that the conntrack is overhead !
I have to tweak it now to get syslog-ng call not flood my DNS…
Any advice ? (again lol ;-))
I know what you are talking about. I have experienced the same when I checked the collected metrics. DNS traffic was responsible for more than 60% of my traffic.
I tried to set up a local dnsmasq to cache requests but because of low TTLs it did not really had the effect I was expecting.
Some months ago I decided to turn it off and looking for other options.
Currently I have only the following ideas.
in fact it looks like verry risky to resolve the dns in the main syslog-ng…
It may cause loop and overhead… it’s what happend to me now !
Can we hope to check dns within kibana in the filter level ?
https://www.elastic.co/guide/en/logstash/current/plugins-filters-dns.html
That DNS filter is for Logstash which is a heavy player regarding its system resource demands.
Of course you could do that. I simply did not want to have Logstash as I wanted a lightweight solution and Elasticsearch itself is already pretty heavy for my HP Microserver.
Great tutorial, I’m struggling with it and almost got something working.
I’m quite surprised to see that long downloads aren’t reported and surprised by this line :
key("${outbound.source.ip}/${outbound.destination.ip}/${outbound.source.ip}/${outbound.destination.port}")Why correlate using the outbound source ip twice ? Shouldn’t we read this :
key("${outbound.source.ip}/${outbound.destination.ip}/${outbound.source.port}/${outbound.destination.port}")?
Thank you.
It was a typo I missed to catch for so long time. I have just fixed it both in the blog and in GitHub.
Indeed we would need the ‘outbound.source.port’ instead of ‘outbound.source.ip’.
There is a timeout set to 600 seconds to wait for context closing events ([DESTROY] logs). This is not ideal but prevents high memory usage on busy servers. When this timeout is reached the context is closed and its duration is effectively ‘faked’ to 10 minutes. You can increase it if you like.
Thanks again for letting me know the mistake I made.
In cases where let say a download takes a lot of time
Having a weird issue where ulodg is showing up in remote syslog messages, but no data is being logged to elasticsearch
I believe I followed everything correctly, only difference is I run elasticsearch on 127.0.0.1
I figured it out, my router wasnt sending hostname over syslog it was sending its ip address.
I set @define router_hostname to its ip address and I have data.
I am glad that you could make it. Thanks for the comments.
I’d love to get this working, but I’m stuck at the parsing.
The ulogs aren’t csvparsed at al, so the rest isn’t working either.
This is the log that comes in:
Nov 8 13:54:50 A.B.C.254 ulogd[12099]: [NEW] ORIG: SRC=A.B.C.1 DST=A.B.C.254 PROTO=UDP SPT=57024 DPT=53 PKTS=0 BYTES=0 , REPLY: SRC=A.B.C.254 DST=A.B.C.1 PROTO=UDP SPT=53 DPT=57024 PKTS=0 BYTES=0Nov 8 13:54:50 A.B.C.254 ulogd[12099]: [DESTROY] ORIG: SRC=A.B.C.1 DST=A.B.C.254 PROTO=UDP SPT=47344 DPT=53 PKTS=1 BYTES=70 , REPLY: SRC=A.B.C.254 DST=A.B.C.1 PROTO=UDP SPT=53 DPT=47344 PKTS=1 BYTES=70
If I’m correct, when only applying the csvparsing, the output should be:
 Nov 8 13:54:50 A.B.C.254 ulogd[12099]: [NEW] ORIG: SRC=A.B.C.1 DST=A.B.C.254 PROTO=UDP SPT=57024 DPT=53 PKTS=0 BYTES=0
 REPLY: SRC=A.B.C.254 DST=A.B.C.1 PROTO=UDP SPT=53 DPT=57024 PKTS=0 BYTES=0
 Nov 8 13:54:50 A.B.C.254 ulogd[12099]: [DESTROY] ORIG: SRC=A.B.C.1 DST=A.B.C.254 PROTO=UDP SPT=47344 DPT=53 PKTS=1 BYTES=70
 REPLY: SRC=A.B.C.254 DST=A.B.C.1 PROTO=UDP SPT=53 DPT=47344 PKTS=1 BYTES=70
This is what’s in the conf file:
 source s_network{
 tcp(ip(A.B.C.1) port(514));
 };
 parser p_csv {
 csv-parser(columns("ORIG", "REPLY")
 delimiters(",")
 );
 };
 destination d_network{
 file(
 "some_directory/network/$HOST/$S_YEAR.$S_MONTH.$S_DAY/messages"
 create-dirs(yes)
 );
 };
log {
source(s_network);
parser(p_csv);
destination(d_network);
};
How can I trace the parsing?
Hi,
Please note that you may want to replace tcp() driver to network() as tcp() is obsolate. (https://www.syslog-ng.com/technical-documents/doc/syslog-ng-open-source-edition/3.21/administration-guide/27#TOPIC-1180468)
However this may not change what you experience.
The parser will be used on ${MESSAGE} part of the message. ie, everything after “ulogd[1234]:”.
Therefore the macros ORIG and REPLY after parsed by csv-parser should look similar to this.
ORIG => "[NEW] ORIG: SRC=A.B.C.1 DST=A.B.C.254 PROTO=UDP SPT=57024 DPT=53 PKTS=0 BYTES=0"REPLY => "REPLY: SRC=A.B.C.254 DST=A.B.C.1 PROTO=UDP SPT=53 DPT=57024 PKTS=0 BYTES=0"
Maybe the namings are confusing a bit but you see where it is going.
I quickly checked the sample of logs you provided with the one I have and they look identical regarding their format so the parser config should be fine. What I can think of is that the log message does not reach the parser at all.
The troubleshooting approach you made is a good one. Remove everything and enable further actions one-by-one.
The debug, verbose, trace modes can be enabled by syslog-ng-ctl to troubleshoot syslog-ng issues. As far as I recall trace is required to see how filters are evaluated.
Unfortunately sometimes all of them must be turned on and it will be very noisy. Try to keep the volume of your logs low while these settings are on.
https://www.syslog-ng.com/technical-documents/doc/syslog-ng-open-source-edition/3.21/administration-guide/92#TOPIC-1180719
Good luck.
This is great. Is it possible to offer the Kibana / Server side of things as a Docker container or compose file with the configs?
Regards
David
Hi David,
What do you mean on Kibana part? Sure you can run the whole Elastic stack in Docker, so as the syslog-ng server. The only ‘dockerless’ part is ulogd on OpenWRT.
Regards,
Balázs
Thank you for the elaborate guide and ready to use files. I have completed most of the steps but am stuck with an error during creating mappings from the Kibana webgui. Could you please help me with this
Unable to create template
[mapper_parsing_exception] A dynamic template must be defined with a name
I am a total newbie to elasticsearch and kibana. I am using Elasticsearch 7.8.0 and Kibana 7.8.0
Hi Bobby,
Try to change the PUT request to look like this.
PUT _template/network_openwrt?include_type_nameI’ve changed a lot about these things recently to be able to use the SIEM module, but have not published yet. I’m going to find some time to update this post.
I hope it works for you.
Hi
Thank you for the prompt response. I am not sure how to incorporate that change.
I can see the final text that goes to elasticsearch to create the template, but there is no way to modify it. I will see if there is another interface from which i can do it
Maybe I will wait for your updated posts on the topic. Thanks again !!
Hi,
You can see some screenshots here to see where to put the content of this file: https://github.com/abalage/balagetech-openwrt-syslog-ng-elasticsearch/blob/master/elastic/elastic-mapping-for-openwrt.txt
You only need to change the first line according to my previous comment after you pasted it into Dev Console.
I will try to make the guide easier to follow. Thanks for the feedback.
Hi
I found the Kibana console and put the content there. Now I am getting the following error
———————————Error on kibana console———————————-
{
“error” : {
“root_cause” : [
{
“type” : “mapper_parsing_exception”,
“reason” : “Root mapping definition has unsupported parameters: [inbound : {properties={destination={properties={address={type=keyword}, port={type=long}, ip={type=ip}}}, source={properties={address={type=keyword}, port={type=long}, bytes={type=long}, ip={type=ip}, packets={type=long}}}}}] [outbound : {properties={destination={properties={address={type=keyword}, port={type=long}, geo.location={type=geo_point}, ip={type=ip}}}, source={properties={address={type=keyword}, port={type=long}, bytes={type=long}, ip={type=ip}, packets={type=long}}}}}] [host : {properties={hostname={type=keyword}, ip={type=ip}, name={type=keyword}, type={type=keyword}, architecture={type=keyword}}}] [event : {properties={duration={type=long}, start={type=date}, end={type=date}}}]”
}
],
“type” : “mapper_parsing_exception”,
“reason” : “Failed to parse mapping [properties]: Root mapping definition has unsupported parameters: [inbound : {properties={destination={properties={address={type=keyword}, port={type=long}, ip={type=ip}}}, source={properties={address={type=keyword}, port={type=long}, bytes={type=long}, ip={type=ip}, packets={type=long}}}}}] [outbound : {properties={destination={properties={address={type=keyword}, port={type=long}, geo.location={type=geo_point}, ip={type=ip}}}, source={properties={address={type=keyword}, port={type=long}, bytes={type=long}, ip={type=ip}, packets={type=long}}}}}] [host : {properties={hostname={type=keyword}, ip={type=ip}, name={type=keyword}, type={type=keyword}, architecture={type=keyword}}}] [event : {properties={duration={type=long}, start={type=date}, end={type=date}}}]”,
“caused_by” : {
“type” : “mapper_parsing_exception”,
“reason” : “Root mapping definition has unsupported parameters: [inbound : {properties={destination={properties={address={type=keyword}, port={type=long}, ip={type=ip}}}, source={properties={address={type=keyword}, port={type=long}, bytes={type=long}, ip={type=ip}, packets={type=long}}}}}] [outbound : {properties={destination={properties={address={type=keyword}, port={type=long}, geo.location={type=geo_point}, ip={type=ip}}}, source={properties={address={type=keyword}, port={type=long}, bytes={type=long}, ip={type=ip}, packets={type=long}}}}}] [host : {properties={hostname={type=keyword}, ip={type=ip}, name={type=keyword}, type={type=keyword}, architecture={type=keyword}}}] [event : {properties={duration={type=long}, start={type=date}, end={type=date}}}]”
}
},
“status” : 400
}
—————————————Error on kibana console————————————–
This looks like the same as Gandalf posted on 07/01/2019
I have Elasticsearch 7.8.0 and Kibana 7.8.0 . I sincerely hope i am not being a nuisance
Thanks
Hi,
I rather try to post my updates soon than figuring out why the version I have is broken.
Regards,
Well i have some huge problems with active connections in my OpenWRT router.
My router send logs via TCP port 601 to remote syslog-ng running in docker container.
Elastic show’s data but after while active connections at my router site shows 99% allowed connections (about 16k udp connections from my syslog-ng) and OpenWRT router start to DROP connections.
You may need to switch to TCP and use so-keepalive() to reduce number of concurrent connections.
great tutorial, thanks for your work!
just one thing: I was looking at the makefile for ulogd-mods-extra and it looks like that pulling that package actually installs the whole suite, but (unless I missed something) most of those mods are unused for this tutorial
Hello,
Having an issue while configuring OpenWrt :
root@OpenWrt:/etc/config# ulogd -v
Mon Feb 7 16:53:02 2022 ulogd.c:408 registering plugin `NFCT’
Mon Feb 7 16:53:02 2022 ulogd.c:408 registering plugin `IP2STR’
Mon Feb 7 16:53:02 2022 ulogd.c:408 registering plugin `PRINTFLOW’
Mon Feb 7 16:53:02 2022 ulogd.c:408 registering plugin `LOGEMU’
Mon Feb 7 16:53:02 2022 ulogd.c:408 registering plugin `SYSLOG’
Mon Feb 7 16:53:02 2022 ulogd.c:981 building new pluginstance stack: ‘ct1:NFCT,ip2str1:IP2STR,print1:PRINTFLOW,sys1:SYSLOG’
Mon Feb 7 16:53:02 2022 ulogd_inpflow_NFCT.c:1399 NFCT plugin working in event mode
WARNING: scheduler configuration failed: Function not implemented
^CMon Feb 7 16:53:06 2022 ulogd.c:1380 Terminal signal received, exiting
root@OpenWrt:/etc/config#
Any idea? Googling gave nothing interesting…
Thanks!
Replying here as well 🙂
I can see the same output when I run ulogd -v but it still works as expected.
Can you see the events logged by ulogd with logread?
Hi,
Firstly, thank you very much for your tutorials. They’re very useful for setting up monitoring of my home network.
I’ve configured ulogd on open wrt and want now to set up this part about forwarding logs to elk.
However, I’ve some problems with this syslog-ng configuration. I’ve checked this configuration on syslog-ng on pfsense and separately on alpine-linux and on both instances shows me an error probably regarding elasticsearch-http:
Error parsing config, syntax error, unexpected LL_IDENTIFIER, expecting '}' in /etc/syslog-ng/elk-log.conf:41:2-41:20:36 template t_network {
37 template("$(format_json --omit-empty-values --pair host.name=$HOST --pair host.hostname=$HOST --pair host.ip=$SOURCEIP --pair @timestamp=$ISODATE --pair ecs.version=1.5.0 --key host.* --key event.* --key source.* --key destination.* --key network.* tags=list($tags) event.category=list(${event.category}) event.type=list(${event.type}))\n");
38 };
39
40 destination d_elastic_network {
41----> elasticsearch-http(
41----> ^^^^^^^^^^^^^^^^^^
42 url("http://192.168.88.141:9200/_bulk")
43 index("network-${S_YEAR}-${S_MONTH}")
44 headers("Content-Type: application/x-ndjson")
45 type("")
46 workers(4)
I know that it has been a while when you published that and it might be an issue with syntax of a new syslog-ng version. I looked at it and didn’t find anything weird but I confess I am not an expert of syslog-ng and maybe you have answer what might be wrong.
Hi,
Thanks for the feedback. Unfortunately I cannot see your whole configuration file of syslog-ng.
I am certain that the version located on GitHub works with syslog-ng 4.0.1.
https://github.com/abalage/balagetech-openwrt-syslog-ng-elasticsearch/blob/master/syslog-ng/etc/syslog-ng/conf.d/network-ulogd2.conf
I have not checked it with more recent version of syslog-ng though.
Hi,
I’ve put literally the same file from yours guthub: network-ulogd2.conf . Only changed parameters of my elk.
It looks that it does not recognize elasticsearch-http … I don’t know why…
Hi,
Make sure you have `http` plugin of syslog-ng installed.
Package is called `syslog-ng-mod-http` on Ubuntu and `syslog-ng-curl` on OpenSUSE. I am not sure about the package names on other distros.
It’s not installed by default.
Hi,
I’ve already installed this syslog-ng-http module and nothing changed. Here is the list of modules I have in syslog-ng on my alpine linux listed from syslog-ng –version command:
Available-Modules: correlation,json-plugin,csvparser,kvformat,cef,regexp-parser,basicfuncs,disk-buffer,afuser,linux-kmsg-format,pseudofile,http,timestamp,affile,afsocket,appmodel,system-source,confgen,secure-logging,metrics-probe,cryptofuncs,azure-auth-header,afprog,rate-limit-filter,hook-commands,syslogformatThe key here is Alpine Linux.
I could reproduce this in a Docker container.
I had to install all these (syslog-ng-scl is the most prominent) to be able to proceed but still it failed on the missing GeoIP2 and getent plugin.
As far as I can see those plugins are not shipped with Alpine Linux.
apk add syslog-ng syslog-ng-http syslog-ng-map-value-pairs syslog-ng-json py3-syslog-ng syslog-ng-sclI’ve commited a separate branch on GitHub with the changes I had to make. Check it out.
https://github.com/abalage/balagetech-openwrt-syslog-ng-elasticsearch/commit/3d425fb152c9154148f9be3e12aa499d7a708d82
Hi,
That works, but now I have another error regarding match(). Probably still lack of something?
 Error parsing filter expression, syntax error, unexpected KW_MATCH in /etc/syslog-ng/elk-log.conf:8:9-8:14:
 3 @define elastic_pass "forensics"
 4
 5 filter f_ulogd_stat {
 6 program("ulogd")
 7 and (d_elastic_network
 8-----> match('NEW' value("MESSAGE"))
 8-----> ^^^^^
 9 or
 10 match('DESTROY' value("MESSAGE"))
 11 )
 12 };
 13
That config snippet does not look good.
Please compare it to https://github.com/abalage/balagetech-openwrt-syslog-ng-elasticsearch/blob/283df7a2423593514fed0f994647f4ad2bf991f7/syslog-ng/etc/syslog-ng/conf.d/network-ulogd2.conf#L5-L12
Also please note that either you need to remove log paths referencing source(chroots) or define that source as empty like this:
source chroots {};
This is not strictly required for you, but the config I had on openSUSE had this.
Right, I did a big mistake. Thank you very much.
Probably copied accidentally “d_elastic_network” phrase.
Now… I am stuck with receiving data on ELK. I am using SOF-ELK distribution and new version uses 8.0 version which shows some errors for mapping.
I also have some issues with index patterns which as I understand, in new nomenclature is now data view. I need to learn more on elk basics do deal with that… I’ll appreciate any help from you.
Don’t worry, you’re on track. I am glad I could help.
I am almost there…
Succeed with mapping and creation of data views in sof-elk.
But now I have a problem on syslog-ng side. When I try to start syslog-ng service it’s saying this error:
[2023-10-04T17:03:56.196508] curl: error sending HTTP request; url=’http://192.168.xxx.xxx:9200/_bulk’, error=’Couldn\’t connect to server’, worker_index=’0′, driver=’d_elastic_network#0′, location=’/usr/share/syslog-ng/include/scl/elasticsearch/elastic-http.conf:29:5′
(192.168.xxx.xxx:9200 is the right ip address of sof-elk reachable from alpine-linux with syslog-ng)
I don’t have idea what might be wrong now…
I would troubleshoot it like this.
– Is port 9200/TCP available?
– Isn’t HTTP accidentally switched to HTTPS?
– What does tcpdump say?
– Is there any hint in the internal logs of elasticsearch?
The problem was with sof-elk distribution. It looks it is not prepared for API calls over HTTP on port 9200.
I’ve started elk with docker and finally it works!
Now I need to change dnsmasq to unbound on openwrt and enable GeoIP.
Thanks a lot again for help!
Sounds like fun 🙂 Good job.
I need your help Németh…
I tried to enable network-unbound.conf in this setup on Ubuntu Server 22.04.
And I have this error log:
Oct 21 16:21:52 ubuntu-server syslog-ng[6170]: [2023-10-21T16:21:52.810388] python-parser: Error initializing Python parser, class is not a subclass of LogParser; parser=’p_unbound_csv’, class=’DNSSuffixResolver’, class-repr=”
Oct 21 16:21:52 ubuntu-server syslog-ng[6170]: [2023-10-21T16:21:52.810401] Error initializing message pipeline; plugin_name=’python’, location=’/etc/syslog-ng/conf.d/network-unbound.conf:93:5′
Oct 21 16:21:52 ubuntu-server systemd[1]: syslog-ng.service: Main process exited, code=exited, status=2/INVALIDARGUMENT
I’ve installed in virtualenv some pip packages like:
– /var/lib/syslog-ng/python-venv/bin/pip install publicsuffixlist
– /var/lib/syslog-ng/python-venv/bin/pip install logparser
– /var/lib/syslog-ng/python-venv/bin/pip install psl-dns
Maybe it is a need to do something more…
The content of network-unbound.conf is the same as yours on github. Only parameters in first lines for connection to elastic I’ve changed.
Have a look at this: https://github.com/syslog-ng/syslog-ng/issues/4259
ps: I think
pip install logparseris something irrelevant for syslog-ng just the name suggest it has something to do with it.Thank you for this article, Would you be able to provide complete Dockerfile’s for both syslog-ng and elastic search please? Like others here I seem to be having issues getting syslog-ng to a state where I have everything needed. I seemed to have followed all the instructions in the article.
I hope it’s not too much to ask and I think it would be a self-documenting build process, ie. apt install xyz packages and here it is in a fully running state.
I also don’t see anything comparable like this out there on the Internet that is so comprehensive as this in terms of monitoring.
Thanks for the feedback. I’m thinking what can I do to improve the user experience on the long run.
Providing container description for Syslog-ng could work, but I will definitely not touch Elasticsearch image descriptions.
I haven’t been really using Elasticsearch anymore as it is too heavy on system resources for a home lab.
I was considering going the low footprint route as well, it’s one of the reasons why I like this approach / project so much.
I’ve looked at OpenObserve (O2) which collects logs + built in dashboard, Grafana can also plug into it. But O2 as a project is still new and the feature request list a long.
Would be interested to hear your thoughts on what you’re considering, there’s a big choice of collectors and visualizers now that seem pretty low footprint. One thing I agree on is ELK stack or EK in this instance is still massively hungry on resources both memory and storage.
Also thank you on considering the Docker request!
Hi David, would you mind having a look at the recent changes I made in the github repo and provide feedback. I would be more than happy.
Excellent great post. I was looking for something like it but you showed up ontop in Google seem you done 99% of it thanks for sharing your knowledge and work.
I see you provided Dockerfile syslog which makes it easier to work with.
Does it also log everything that is sent to hardware NAT ? I would think so because I can see those in nftable conntrack in OpenWRT.
I want to know if using the Elasticsearch solution will consume fewer resources compared to the Prometheus and Grafana solution.
According to my experiences Elasticsearch requires much more resources than Prometheus and Grafana.
The main difference lies in that Elasticsearch does full-text indexing while (I assume you mean Loki here) Loki does selectively labeling metadata.
For some use cases both does the job just fine.
Great idea of use syslog to monitor openwrt. i think syslog could be export to loki and then i could use grafana to monitor