
In the last post I wrote about how you can create a central syslog server. This time I will show you how you can use syslog-ng to parse fail2ban log messages, enrich it with GeoIP metadata and send into Elasticsearch. You can even visualizing Fail2ban logs in Kibana to see where the failed login attempts are coming from.
Update: This post has been reviewed and all Fail2ban and GeoIP related contents have been merged here from the previous post. Look no further, you will find everything you need here. Note that this guide requires Elasticsearch 7.x.
This guide uses syslog-ng to transform the logs into a JSON payload enriched with GeoIP metadata. Also it can parse further meta data from logs and store them in Elasticsearch.
Table of Contents
Parsing fail2ban’s logs to get GeoIP metadata
My DIY home server is reachable from the public Internet and is being scanned by botnets all the time. One solution I use as a basic defense is Fail2ban. Fail2ban analyzes login attempts on SSH by parsing authentication logs of sshd. When it finds hosts with failed authentication attempts, it bans their IP addresses with the firewall for a while. It can be extended to other services too.
Some time ago, one of my friend created a post about visualizing login attempts on a world map based on their GeoIP data. His guide used iptables logs, but I wanted to use Fail2ban’s logs to get the same information.
This use case is special as we do not use anything from the original log message except the IP address. The events we create will be 100% compatible with Elasticsearch ECS, it will store the original message as well.
Setup collecting and parsing logs of Fail2ban
- Fail2ban by default logs into a file. Although I could use that file by syslog-ng, I wanted it to log to syslog instead, so syslog-ng will get all the logs by default.
To do that I had to change “logtarget” option to “SYSLOG” in Fail2ban’s configuration.
You can find that setting in file: /etc/fail2ban/fail2ban.conf# Option: logtarget # Values: [ STDOUT | STDERR | SYSLOG | SYSOUT | FILE ] Default: STDERR # #logtarget = /var/log/fail2ban.log logtarget = SYSLOG
- As the syslog-ng configuration is lengthy I will not paste it here. You can find the complete configuration on GitHub. Save it as /etc/syslog-ng/conf.d/fail2ban-geoip.conf. Explanations will follow below.
- The patterndb feature of syslog-ng will parse the logs of Fail2ban. It parses the original log message with the patterns and parsers shown below. You can se the parsed values in syslog-ng macros. The macro’s name is our case is “ip” and its value is the parsed IP address. Should you want to read more about it, then check the admin guide.
The patterndb I use can be downloaded from here. Place it in /etc/syslog-ng/patterndb-fail2ban.xml<!-- https://superuser.com/questions/1018927/what-is-found-in-fail2ban-log-file --> <?xml version='1.0' encoding='UTF-8'?> <patterndb version="4" pub_date="2018-06-05"> <ruleset id='c16cd58c-37d3-42c1-b7ea-50ca2e24f864' name='fail2ban-server'> <pattern>fail2ban-server</pattern> <rules> <rule class='violation' id='c16cd58c-37d3-42c1-b7ea-50ca2e24f864' provider='balage'> <description></description> <patterns> <pattern>fail2ban.filter @QSTRING:pid:[]@: INFO @QSTRING:jail:[]@ Found @IPvANY:ip@</pattern> <pattern>fail2ban.actions @QSTRING:pid:[]@: NOTICE @QSTRING:jail:[]@ Ban @IPvANY:ip@</pattern> </patterns> </rule> </rules> </ruleset> </patterndb> - The GeoIP database is a snapshot. It needs to be periodically updated. I use this SHELL script in a cronjob to periodically fetch updates and reload syslog-ng service.
#!/bin/bash

set -o nounset
DB="GeoLite2-City.tar.gz"

TMPDIR=$(mktemp -d)
cd ${TMPDIR}

wget -q http://geolite.maxmind.com/download/geoip/database/${DB}
wget -q http://geolite.maxmind.com/download/geoip/database/${DB}.md5

MD5SUM_CREATED=$(md5sum ${DB} | cut -d" " -f1)
MD5SUM_HOSTED=$(head -n1 ${DB}.md5)

if [ ${MD5SUM_CREATED} != ${MD5SUM_HOSTED} ]; then
    echo "md5sums do not match"
    echo "'${MD5SUM_CREATED}'"
    echo "'${MD5SUM_HOSTED}'"
    exit 1
fi
tar -xf ${DB} -C ${TMPDIR}
rm ${DB}
rm ${DB}.md5
SUBDIR=$(ls -d -- */)
cd ${SUBDIR}
cp GeoLite2-City.mmdb /etc/syslog-ng/
chown root.root /etc/syslog-ng/GeoLite2-City.mmdb
systemctl reload syslog-ng
rm -rf ${TMPDIR}
The crontab entry looks like this. It runs syslog-ng-update-free-geoip-db.sh on every Sunday at 4 AM.
0 4 * * 6 /usr/local/bin/syslog-ng-update-free-geoip-db.sh
Please note that everything can be downloaded from this GitHub repository.
Create index template for Fail2ban in Elasticsearch
Before we do anything we need to decide how the index which stores the events would be called. In my case it is called ‘fail2ban’.
Elasticsearch thanks to dynamic datatype mapping can create mappings for the ingested data. It usually implicitly assigns the keyword data type for data. However the Coordinate Map visualization relies on a data type called geo_point which must contain latitude and longitude data. This data type must be explicitly set. Also other data attributes may require explicit mapping like IP addresses, PID numbers, etc.
The following PUT Mapping API command creates the index template called network_fail2ban and applies the following mapping to that.
The index pattern ‘fail2ban-*’ will match logs spanning over different indexes files, all named according to the template ‘fail2ban-YYYY-MM-DD’. Syslog-ng will specify this template.
PUT _template/network_fail2ban
{
  "index_patterns": ["fail2ban-*"],
  "settings": {
    "number_of_shards": 1
  },
   "mappings" : {
      "properties" : {
         "host" : {
            "properties" : {
               "name" : {
                  "type" : "keyword"
               },
               "ip" : {
                  "type" : "ip"
               }
            }
         },
         "source": {
           "properties" : {
              "address" : {
                 "type" : "keyword"
              },
              "ip" : {
                 "type" : "ip"
              },
              "geo.location" : {
                 "type" : "geo_point"
              }
           }
         },
         "process": {
           "properties" : {
              "pid" : {
                 "type" : "long"
              },
              "name" : {
                 "type" : "keyword"
              }
           }
         }
      }
   }
}
You can use the built-in Console of Kibana that you can find under Dev Tools to apply this command. See the screenshot from a previous version below.
 The mapping must be done before the index is populated with logs. (Reindex exists but usually it requires transferring data from one index to another.)
Send Fail2ban logs into Elasticsearch
Syslog-NG can directly send logs to Elasticsearch. The log format I use comply to ECS standard. Without the need for Beats or Logstash! The configuration file uses elasticsearch-http destination driver to send logs to Elasticsearch.
Create index patterns in Kibana
To be able to Discover all the details of the logs, we must instruct Elasticsearch to create an index pattern for Kibana in advance of receiving any events.
Rememer the index template above used index patterns to match indexes. Kibana index patterns will match the index names and creates mappings for the contents as well. Take a minute to digest this information.
You either need to create an index pattern manually the way it is described below or import all the patterns, visualizations and dashboards from my repo. You can import them in Management → Kibana → Saved objects → Import.
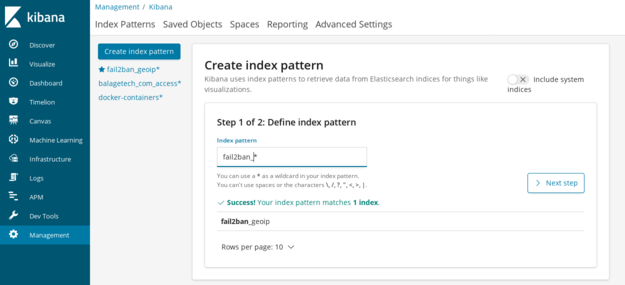
To create an index pattern manually, go to Management → Kibana → Index patterns → Create index pattern.
- Type in the index name fail2ban-* and click Next step.
- On the next screen you should select a Time Filter. Set “@timestamp” from the drop-down menu.
- Warning! Fold open Show advanced options and type “fail2ban” as an internal name for the index pattern. If you leave this empty then Kibana will generate a random UUID for that. Setting it to “fail2ban” will give you the option to use my saved visualizations and dashboards which rely on the string “fail2ban”.
- When selected click on Create index pattern.

- If you succeeded then you should be able to use Discover to browse the logs you already have.


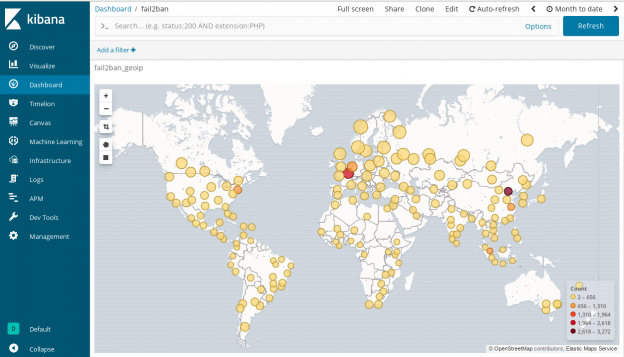
Visualizing Fail2ban logs in Kibana
In Discover menu, you can scroll down and see all the available attributes. They are provided by syslog-ng via GeoIP and PatternDB and map-value-pairs() parser. If you find source.geo.location you will notice that its icon is different, so as the icon of source.ip and process.pid. They represent different data types.
Clicking on source.geo.location reveals a Visualize button, let’s click on that.

Voila, the world map we were working on.

You can even customize the visualization. I hope you like it.
If you liked this content then please share it on any platform you like. I will highly appreciate it. Also should you have anything to add then please make any comments below.
Would you like to read more about this topic? You should check the tutorial about how you can create a central syslog server. In case you already have one, you can extend it by using a simplified guide to logging Docker to Elasticsearch as well.
looks like this is broken with the move to syslog-ng 3.25.1
syslog-ng-mod-geoip has moved to syslog-ng-mod-geoip2 which isn’t playing ball.
i have had to modify the config on syslog-ng to include the username and password for elasticsearch to get it to connect. and i am now getting the following sort of error’s;
geoip2(): getaddrinfo failed; gai_error=’Name or service not known’, ip=”,
I’ve been using this with 3.25.1 for a while, so it should not depend on the version. The pluging geoip2 gets loaded as it threw that error message.
Looks like your issue is that the ip= is empty. Take a look around why that could be missing.
looks like the patterndb.xml was a bit screwy on my install.
fail2ban-server isn’t the name of the program in the logs its f2b/server in my case.
note, this is on Ubuntu 20.04, so might be something that has changed?
in either case, working now…. thanks for the writeup.
I am happy that it works now. No problem.
Can you help how to do it using filebeat
Hi Emmanuel,
Filebeat’s system module should pick up fail2ban’s logs that you can send to Logstash for further enhancement like GeoIP enrichment or use an Ingest Pipeline on Elasticsearch itself.
Please note that I haven’t tested this setup so far, but the following guide could give some help.
https://www.elastic.co/guide/en/elasticsearch/reference/master/geoip-processor.html
Regards,
Hello Do i need some configurations on filebeat or fail2ban to show the logs in Kibana?
You only need to make changes around logstash or ingest pipeline to parse and enrich fail2ban logs. Filebeat’s system module will only do basic parsing of syslog messages based on their header but not on the messages itself.