
Monitor home network traffic with OpenWRT and Syslog-ng with Elasticsearch Security. I wanted to see what happens on my home network. Is there something going on I should be aware of? Is there any device which creates suspicious connections like phoning home? I will use OpenWRT and syslog-ng to get the answers and Elasticsearch Security to get the analytics.
Important updates: 12/02/2023
This post seems like getting some of attention from various people recently and I am very happy about it. I understand the need of reproducible configurations both for Syslog-NG and Elasticsearch, I would expect it too. I tried to address most of the problems mentioned in the comment section. The following changes occurred.
- syslog-ng’s configuration has been refactored and updated to match up version 4.5.0, also many hard wired settings are now populated via environment variables.
- A Dockerfile is provided to help people who requires container images. This image is only meant for transforming fail2ban, dnsmasq, unbound and ulogd2 logs to Elasticsearch. Although you can send any kind of logs to TCP 6514 (IETF syslog) or TCP 514 (BSD syslog) of the container, do not expect them to be properly indexed by Elasticsearch.
- Be aware. The Dockerfile initializes a copy of GeoLite2-City.mmdb from a 3rd party site. It is only for testing, implement your own method to fetch maps complying to the license requirements.
- The legacy index template “network” has been converted to composable template. Tested it with Elasticsearch 8.7.1
- Elasticsearch was installed by using this elkninja/elastic-stack-docker-part-one/docker-compose.yaml.
Regarding Elasticsearch I have changed my mind. It is simply an overkill for most people who monitors home network traffic with OpenWRT and Syslog-ng. Even I myself have abandoned it 2 years ago. Although I updated Elasticsearch configurations but they are not thoroughly tested and I am not even planning to test it in the future. I have plans to look for another more lightweight solutions for visualizations. And maybe run it next to Home Assistant on Kubernetes. 🙂
About monitoring home network traffic with OpenWRT and Syslog-ng
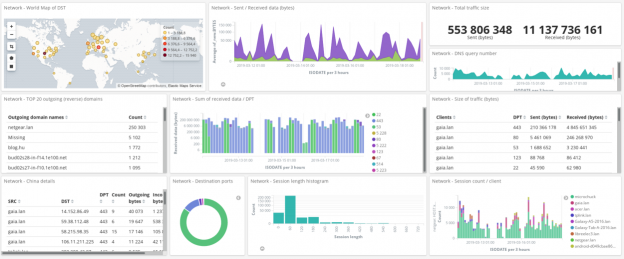
SOHO routers are usually not really resourceful, neither is mine. Therefore I needed a solution using as little resource as possible but still capable to answers that questions. My solution uses connection tracking data from an OpenWRT router. Offload the information from OpenWRT to a central syslog server. Enrich it with GeoIP and session length metadata by using syslog-ng. Then analyze the logs with Elasticsearch. Recently it has been also enchanced with DNS information thanks to either dnsmasq or unbound DNS servers.
The first part of this blog series answers where the packets come and go and some metrics. What are inside the packets is up to another posts. Continue reading Monitor home network traffic with OpenWRT and Syslog-ng and Elasticsearch Security